Library/GTM Vault Podcast 29
Speed as a GTM Wedge: AI in Clinical Trials
How Miracle is using AI-powered dashboards to eliminate delays across sites, labs, and trial systems
Welcome to GTM Vault - trusted by 25,000+ GTM leaders building the future of revenue.
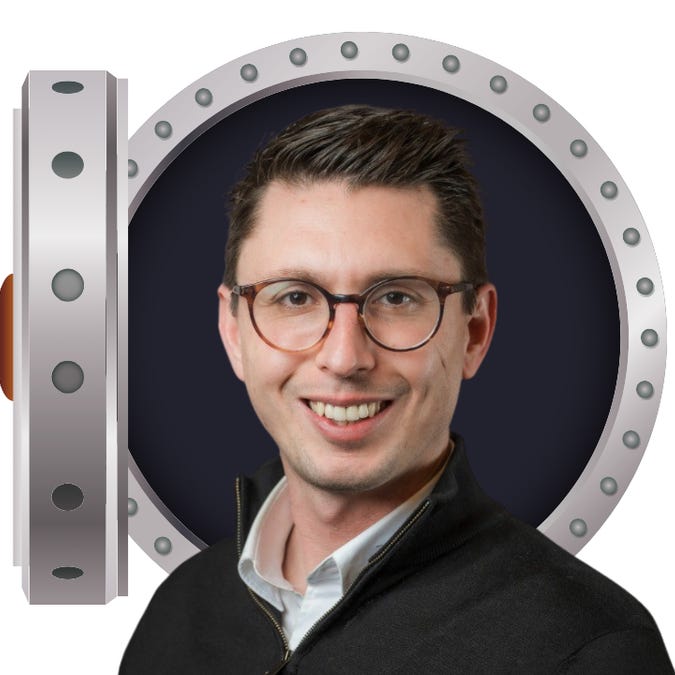
This week’s guest is Jin Kim - MIT graduate and founder & CEO of Miracle (YC), a clinical operations platform transforming how trials are run across biopharma. Miracle delivers real-time visibility across systems, sites, and vendors - helping biotech teams detect risks early, improve oversight, and finish studies months ahead of schedule.
Before founding Miracle, Jin worked across clinical operations and data science, witnessing firsthand how fragmented systems and manual trackers slow drug development. At Miracle, he and his team channel that experience into a platform that unifies every dataset and stakeholder into one source of truth - so teams can anticipate issues, stay compliant, and make decisions with confidence.
“Miracle shines a spotlight on what used to be a black box - giving biotech teams real-time oversight to see what’s working, what’s not, and finish studies months ahead of schedule.”
This episode is for clinical ops leaders, biotech GTM operators, and anyone curious how visibility, data, and accountability can reshape life sciences.
[ GTM Vault
AI-Native GTM systems and playbooks helping B2B founders and operators build repeatable revenue.
By Rick Koleta](https://gtmvault.wiki?utm_source=substack&utm_campaign=publication_embed&utm_medium=web)
Listen & subscribe now across:
YouTube // Apple // Spotify
In This Episode
- Jin’s journey: the challenges that led to Miracle
- How data silos slow down trials
- What it takes to build unified, integrated data systems
- Daily data cleaning and maintenance
- Enrollment forecasting & site strategy
- Real-time tracking (especially for rare disease and decentralized trials)
- Dashboards, alerts, and communications with study sites
- Holding teams, vendors, and sites accountable
- Compliance, security, and regulatory guardrails
- Onboarding expectations & time to value
- Future of clinical ops: AI, automation, and what’s next
- Rapid Fire: Key lessons & closing thoughts
5 GTM Takeaways to Steal
- Live visibility > static reports
- Integration is the foundation, not optional
- Forecasting only works with unified data
- Accountability is baked in with transparency
- AI can scale ops — but only after the data plumbing is in place
Episode Highlights
00:00 – Intro: Meet Jin Kim & the vision behind Miracle
03:01 – The cost of data silos in clinical trials
06:00 – How Miracle integrates across disparate systems
08:20 – Continuous data cleaning & quality
11:03 – Enrollment projections & optimization
13:31 – Real-time tracking in rare and decentralized trials
15:38 – Dashboards and site communication
17:58 – Accountability across teams, vendors, and sites
20:43 – Compliance, security, and regulatory guardrails
23:09 – Onboarding, expectations & initial value
25:35 – The future of clinical operations: AI & beyond
28:09 – Rapid Fire: Key insights & closing thoughts
Further Reading
Want to go deeper? Here are related GTM Vault playbooks and frameworks:
- Clip Farming: The 2025 Distribution Exploit for Founders
- The State of AI GTM – 2025 Edition
- The Agentic Marketing Playbook
- The Future of GTM Isn’t Bigger. It’s Smaller.
- The Hidden Growth Engine in AI Search
Help Us Build What’s Next
We’re exploring new GTM Vault tools — from a Substack Homepage Optimizer to a GTM Trend Copilot and Operator-grade Automations.
Sponsor Spotlight: ZoomInfo

You might know ZoomInfo for contacts and emails — the fuel behind SDR teams. But ZoomInfo has quietly rebuilt itself into something much more powerful: a system that automates your entire GTM motion.
Signals come in. Outreach goes out. The list gets worked. Plays get triggered. Automatically.
ZoomInfo calls it GTM Intelligence. It’s not enrichment. It’s execution.
Thanks to our sponsors who help keep this newsletter free and high-signal. Want to reach 25,000+ GTM leaders? Explore sponsorship options here.
Connect
Follow Jin Kim: LinkedIn // Miracle
Follow Rick Koleta: LinkedIn // RiteGTM
Miracle aims to cut months off trials — and this episode shows exactly how data, transparency, and emerging tech can get you there.
Catch up on all GTM Vault episodes →
Full transcript
Machine-generated transcript from the episode video. Speaker labels are not included and some names and product terms may be transcribed phonetically.
[0:00] I've learned that the best founders are always selling. Welcome to the GTM Vault podcast hosted by Rick Kleta. We uncover the strategies, the pivots, and the breakthroughs turning startups into giants. Let's crack, open the vault, and find out how. Today on GTM Vault, I'm joined by Jyn Kim, founder and CEO of Miracle, the platform bioarma companies turn to when spreadsheets, annual updates, and blind spots become unacceptable. Miracle delivers live visibility across key trial systems, data capture, drug supply, labs, safety, and vendors. Users report finishing trials ahead of schedule, surfacing risk early, reducing wasted effort, and making faster decisions with confidence. In this episode, we'll explore how Miracle came to be, the operational and data friction points that consistently hold trials back, what it takes to create a control tower view in clinical ops, and practical steps you can take right now to reduce delays, improve oversight, and protect both time and budget. You know what I see a lot? Companies with solid strategy, but terrible execution.
[1:17] They've got dashboards, reports, tools everywhere. But no one knows what to actually do next to scale their business. That's why I've been paying attention to what Zoom Info is doing. They're not just a contact data company anymore. They built a full system of execution. They're calling it GTM Intelligence, and it actually works the list, writes the outreach, and triggers the play. No guesswork, no manual grind, just pipeline moving, predictable growth strategy that actually delivers. Check it out at zoominfo.com. Want to get right to it. What specific observations led you to see that trial delays often stem from process and visibility problems rather than scientific issues? Yeah. And Rick, thanks for having me.
[2:03] Um, and what ultimately let me down following Miracle was I used to work in health tech and I used to work with a number of different big pharmaceutical companies like GSK, Biogen. And what stood out to me was there's a lot of data that's being gathered in drug development and especially clinical trials. But what was very astounding was despite having all the data, none of them really talk to each other. All the different data exists in different silos. And what you had was people manually fetching CSV files, copy pasting the information into Excel spreadsheets, a single view into Excel just so that they can make decisions regardless of caring about what the data was with within each system. Ultimately what you need is a single unified view and you know we can get into some of the nuances there and only by having all the data at your fingertips in a single single view that makes sense right in a normalized consolidated way can biotech teams make informed decisions and that's really the key insight that kicked me off on miracle here was instead of pulling the data manually and wasting time every time why not just sync the data and let the data do its thing and you know I think fast forward to today
[3:16] you You know, having worked on a ton of studies across phases one through three and across different therapeutic areas, it's working. Having information at your fingertips, knowing delays when they occur, not next week when someone has time to put together spreadsheet trackers, it helps biotech teams make faster decisions today and keep everyone informed and everyone in the loop and also have important oversight over not just the sites that they're working with, but different vendors and even individual team members who maybe they need to keep an eye out on what should I be focused on and who are and what needs to get done by today. in your background and early work, what lessons from MIT or other experiences shaped your view of what clinical operations needed to become? That's a really good point. Uh, so my background, I studied computer science at MIT, but I was also a premed and I was once on a track to become a physician. And I think that really gave me a really interesting exposure to both healthc care where I've spent countless hours shadowing physicians, talking to physicians, nurses, caretakers, but also having studied at one of the best engineering schools, I was at the intersection of both. And when I embarked on this journey to found
[4:28] miracle and ultimately help drug development, understanding all the different nuances within healthcare, all the different stakeholders, not just a pharma, but also how clinical trials impact ultimate care across physicians, payers, patients, and also really understanding how to build technology in a way that, you know, we're not just throwing features, but in a way that all of the stakeholders are accounted for and really understanding what clinical operations needs, I think put me at the right intersection to build something that people in clinical trials need. I I think going back to um what I had mentioned earlier about letting data do its thing was I think I was just put in the right spot at the right time by seeing how people in clinical trials, especially clinical operations teams at biotech companies, they were wrangling with data and unfortunately spending too much time trying to figure out how to put things into Excel. but knowing how the clinical trials and what metrics that clinical operations teams need and want and knowing how to bring that data into their fingertips without all that manual work was really again you know I was I think I was in the right place at the right time.
[5:39] Miracle supports integrations with systems like electronic data capture, interactive response technology, randomization, trial supply management, lab systems, safety data recruitment vendors. Which of these are hardest to unify and why? I kind of want to say that uh welcome to a world of acronyms, right? EDC, IRT, RTSM, those are all the acronyms to all the systems that you had listed off. When it comes to pulling data, I don't think there's any one key system that's more difficult than other per se, but rather there are a lot of legacy systems. There are a lot of systems that are very study specific as well. And also, it also depends on who's implementing these systems, right? So if we're running a phase 2 autism study as an example, it ultimately depends on which team is implementing the EDC, which team is implementing the IRT and central labs. And you know, just to give you an example, EDC might list visits as visit one, visit 2, visit 3. And might list visits as week 1, visit 1, week 2, visit 2. when you and I read that we know that visit one from IRT uh visit
[6:48] one from EDC corresponds to week one visit one and IRT but machines don't know that and that's the kind of data normalization we need to do when we integrate the data and bring it into a single uh a single single database how does Miracle handle continuous data cleaning and update workflows when new data comes in especially for complex subjects like safety events or patient profiles. Yeah. So when data comes into Miracle, when we're pulling data from EDC, RT, RTSM, central apps, we support a number of different use cases as you pointed out like safety, patient profiles, medical monitoring at the subject level. And even at the study level we can get into data management study forecasts and how we keep track of all the data and how we clean all the data is well first now is we've worked on a number of studies over the years and we've we've seen how to handle that data but especially in our early days it was really making sure that we keep an eye out on what exactly do clinical teams want right if it relates to safety and let's say they're they have specific adverse events that they're looking for also also known as uh AESI special interest. It's making sure that we not
[7:59] only have the rules that are built in place so that as we're pulling the data from these systems, we flag which ones fall into that criteria, but it's also making sure that the rule works, right? So, it's not just setting it up and you know leaving it and forgetting, but making sure that we check in and work closely with our customers so that whatever the rules that we have built out, it's actually working. But also as the study progresses, what teams are focused on at the beginning of the study and the middle of the study and at the end of the study, there's changes and and their focus shifts a little. So, it's making sure that we're working shoulderto-shoulder with each of our customers to make sure that they're getting the metrics that they need. Miracle offers scenario planning and enrollment projections. What data goes into those models and how accurate are they in realistic settings? Yep. So what we've been able to build over the years is working closely with our customers on their clinical trials and their enrollment is to really model out and forecasting timelines of enrollment. So if you have, you know, 50 screenings, let's say, yeah, let's assume that we have 50 screenings per week and you can assume five randomizations per week and you're trying to enroll 365 people into your
[9:10] study, right? It ultimately becomes a very simple math problem of taking a look at actual screening rates, screen failure rates, randomization rates, and how many more randomizations you need, what's your enrollment goal, and based on your current enrollment funnel, how many people can you expect to have enroll in your study, and also bacon assumptions for how many people that you expect to drop out of the study. With those variables in place, it ultimately becomes a very simple math problem. And we can also refer to external databases like clinicaltrials.gov. It's not always the most accurate, but we can definitely infer when did biotech teams set out to complete the study. They often have primary completion is estimated primary completion dates and we can keep an eye out on do these primary estimated dates pull up or push back and try to infer why that might have happened. And we can also keep track of the number of different sites that go um that were listed or perhaps removed. And using a number of different kind of variables like that, we can establish some sort of uh forecast planning models. And you know, in terms of accuracy, uh there's so many variables and we do our best to help our customers keep an eye out on their timelines. For example, if they do
[10:22] something right, did that pull up our timeline, push back our timeline? And of course, we always we also give uh best case and worst case scenarios as well. But one thing that I feel very rewarded by is many of our customers have always finished their studies ahead of their planned timelines. And our forecast tool always becomes not necessarily the truth, but something that they're working towards, right? And it it serves as a reference for them to be able to um to know what's the worst case scenario and based on what changes have we been able to pull up our timelines and what more should we be doing to continue pulling up the timelines. How do you detect underperforming study sites early and what levers do teams usually pull to adjust scores? We always see most successful study teams do is their clinical operations teams especially their director or head of clinical operations are on top of their relationship with sites. They're constantly calling, emailing, texting with the PIs or the the nursing staff at the each of the clinical sites. What we try to do on our end is in addition to that we provide a site level view of breaking down the performance of how quickly are sites acting on referrals if they receive it as an example if they if
[11:33] they have referral based recruitment but how quickly are those turning into screenings and randomizations and also getting into a very granular view of their screen fail rates not just today and cumulative but over time are there trends upward downward trends and ultim ultimately comes down to enabling our biotech teams to have better communication with their sites. Many of our customers, they pull up Miracle on their phone as they're visiting sites so that they know exactly what the latest performance was. Having a conversation with the sites on saying, "Hey, your the number of screenings and randomizations, they were great a month ago, but it slightly dipped, right? What's going on and what can we do to turn things around?" And you know, I think having that kind of information is key to making sure that the study teams and the sites are having great communication around that and resolving issues together.
[12:24] Could you share a trial where Miracle helped shift timelines? Which metrics moved first and how did those shifts cascade into finishing early? Yeah, that's a really good question. And I think one example that I I'll share is for one of the studies that we had work on, there were a couple of recruitment vendors that were feeding referrals into the study. And many study teams do this, but they bring in a number of different recruitment vendors just to make sure that they have a consistent number of referrals that are feing into study. We can kind of think of this as a top-up funnel. But what a lot of people don't realize is every recruitment vendor has a different strategy and you might get different conversion rates, right? And what we've helped our customer do in that case is exactly quantify if you spend X amount of dollars for recurment vendor A, recruitment vendor B, how many referrals can you expect? But from those referrals, how many screenings, randomizations, and ultimately end of study and end of treatment can you expect? We helped follow and basically essentially map out the total overall conversion funnel. But we were able to also spot if recruitment vendor A is feeding referrals into a specific site referral if recruitment vendor B might also be feeding referrals. For example,
[13:38] if a site is getting 400 referrals every single week, but they really only have capacity to take on 100, then 300 referrals that were sent to them that week are technically raised it. So being able to dig very deep into each site has an optimal number of referrals, making sure we capture that and optimizing the number of referrals. By being able to do that, we were able to not only help optimize the dollars that were being sent on different recruitment vendors, we eventually helped the sponsor the the biotech team make an informed decision on which ones to wind down and which ones where you want to keep and bring all the dollars from the other vendors into that one recruitment vendor. fine-tune the volume of referrals that each site gets, but also trying to forecast when's the right time to cut off those uh the referrals at the end of the study so that you minimize that overshoot. So with all of those, you know, we were able to help this customer make faster decisions and they've shared that they finished 3 months ahead of their initially expected timeline. For smaller biotechs or those in rare disease research, what changes happen when visualization and real-time tracking replace manual trackers, especially in rare diseases, right?
[14:47] These studies are enrolling so many fewer patients than other studies, right? And every single patient becomes super precious. It becomes more critical to making sure you understand why are there adverse events? um what kind of comments are they taking or if they're not adhering to um you know the dosing that's required or the level the types of different activities that required keeping an eye out on that. You know, many of the systems do have a lot of alerts um that support the study teams already, but what we've learned recent what we've learned uh especially this year is that often times it's not granular enough and you don't want to risk missing even a single signal. And that's where Miracle um our team has filled the gap by allowing our biotech customers to set very granular thresholds and criteria. So that if let's say there's a specific condition that a patient has and if a patient has this condition but also misses a few activities in the study, right? Knowing right away, triggering a alert and sending an email to so that everyone knows to follow up. That's the kind of gap that we've helped fill. And you know
[15:59] that's the kind of level of uh detail that study teams need so that um you know you can you know you won't miss any of those signals. What changes and habits or rituals do teams make when they adopt real time dashboards instead of relying on weekly or monthly reports. Now, we've seen this happen over and over and over and again is the first time that people start using Miracle. It does feel a little weird because it feels a little too easy before they've had to spend a couple of hours copy pasting information from all of the different spreadsheets into a single Excel tracker which they use to then communicate with senior leadership, the board, the medical teams, data management teams. But now, everyone just has a access to the real-time view. And of course, that view is catered to all of the different roles. But now people have those precious hours. Previously we sit on making those spreadsheet trackers freed up to now react to the data and make faster decisions and be more proactive about what they expect to happen at sites. And in so it really takes them from having been reactive to now being more proactive, especially if something happens at a site, following up immediately right then and there. Or if there's a certain risk in the study, being able to communicate quickly with senior management. And oftentimes senior management used to send emails to head
[17:14] of clinops or directors or folks um or the study team to get updates but now letting senior management have direct access to miracle so that they can get information on the fly and some of the cool metrics that we've seen there was a very skeptical biotech customer at one point but once they started using miracle their head of clinical operations was in miracle seven times a day on average and their CEO was also a miracle once a day on average. And this is inclusive of weekends and holidays too. And so seeing those kind of metrics, you know, kind of made us realize as soon as people have this information on the fingertips, you know, they keep coming back to it because before, you know, I think uh one of the analogies that one of the CEOs of one of our customers have made was basically Miracle is uh Miracle is shining a spotlight on what used to be a black box for clinical trial management. They didn't know what they didn't know. And by miracle shedding a light on all the different aspects of the study, now they can take a look and see what exactly is going on, what's working, what's not working, and ultimately having everyone
[18:23] stay up to date across all the different functional teams are helping them make faster and proactive decisions. It sounds like there are several different stakeholders involved. How do you ensure accountability across internal teams and external vendors or CRO's when performance metrics are visible by site and by function? Yeah, that's that's a really good question. Throughout the study, safety teams may be focused on different aspects and what data management is focused on and what the actual study team focused on enrollment might be looking at. and rightfully so. They have different trackers, different metrics that they care about, but everyone's goal is the same, which is ensuring that you finish the study on time and ultimately work towards getting positive data from the study. And that's where Miracle has really brought all the teams together into a single portal and added a layer of oversight so that safety teams can understand how is recruitment going, how is data being cleaned, right?
[19:19] And also if CRO's are handling site monitoring visits to clean the data, reviewing queries and you know pages on each visit, how many pages are actually being cleaned, what was proposed and right, how many pages did they say would be cleaned and being able to quantify exactly what work has been done and you know often time more often than not CRO's already kind of provide this kind of level of reporting on the work that they do too. But instead of blindly trusting what the CRO's are reporting, now having another report within Miracle to be able to go up against and compare what the CRO's are reporting, it gives you an opportunity to say what were the differences? Why were there differences? And if there were have been delays, why have been there have been delays? or even when it comes down to which CRO monitor is making the visits and being able to quantify okay monitor A made the visit 500 pages were cleaned but when monitor B made the visit only 350 pages were cleaned and for one visit the difference of 150 might not matter so much but if you start to pattern match and and you know there's a consistency in that in the number of pages that are being cleaned say at the tail at the very end of the study there's 5,000 pages that need to be cleaned from a
[20:31] study from the biotech perspective Of course, you would want the monitors doing more productive and efficient work to be doing those kind of monitoring visits. So, you know, even kind of surfacing that level information helps conversations get started and so that study teams, the biotech teams can make better informed decisions by knowing what's going on. As data transparency increases, what measures are critical for maintaining security, audit trails, regulatory compliance, especially in safety and patient data? Yeah, as transparency and data increases, to be fair, we're the data that the that we're we're surfacing in Miracle, it's already data that study teams already had access to. We're just making it easier to have data and instead of them putting in all the different manual work, it's more automated. So, in that aspect, the level of transparency, hopefully it's the same level of transparency that study teams had before, too. It's just more frequent and more often. And you know by I think frequency is one of the differentiators because by having more realtime updates from the study especially on safety and you know these kind of medical stuff the
[21:42] study teams knowing exactly when there are side effects and being able to decipher is this safety event related to actually what was happening in the study right is it related to the drug that we're testing or was it related to their medical histories or their existing medication right so being able to answer those questions. Definitely having that increased transparency helps study team stay on top of that more. What are common pitfalls when centralizing data and how do you mitigate risks of inconsistent or erroneous data entering decision-m? Yeah. So when it comes to minimizing erroneous data, I I think the first thing is seeing how the data is entered. And so often times the data that we're getting from the EDC and you know all the different study teams, all of the different study systems, they already go through some sort of validation already within the systems themselves. But I think where we often catch um and help flag inconsistencies might be as we're putting together all the data from these systems, right? being able to say for date of screening as an example might come from the EDC and making sure that what's coming from the EDC is consistent with what's listed in the IRT or even
[22:52] the central labs and making sure that data is uh correctly entered across all the different systems. That's one aspect, but also the second is making sure the data is being entered on time and being able to get down into the details of if data is being entered into the IRT on September 18th as an example, why doesn't it show in the EDC until September 25th? And so being able to break down why might there be delays? Is it a site data entry delay or is there an issue with the data that was being entered? Um and I think that that's the kind of stuff that our team has been able to help biotech teams ensure that all the data is being entered consistently and on time uh into each all of the systems. I want to dig a little deeper into your go to market and adoption dynamics. What messaging resonates most with biioarma execs? Speed, cost savings, risk reduction, regulatory safety, or some mix of these? Rick, that's a really good question and it ultimately ties into how I approach selling to software, right, and bringing miracle to um the biotech teams. First, you know, the audience that we typically work with are senior executives at biotech companies. And we've, you know, we've been a little bit
[24:07] more focused on the small to medium-sized biioarma companies that are working on clinical trials. And how I approach it is, you know, I never try to sell on features, right? I personally don't care how many more features that our product has compared to Excel or any of the other tools that they might be using. What I always focused on is pain points and what kind of problem that they're actually dealing with. And a lot of the clinical operations executives already have and they've already they've already run studies for decades, right, for 20 30 plus years. And they've already have a good sense for what they need and you know who to have on their team. But what I think really supercharges and what's at the root cause of their pain point is how can we make faster and uh better informed decisions, right? And it ultimately comes down to time, right? How do we not waste time trying to gather information?
[24:58] How do we make faster decisions? So, it ultimately comes down to saving time. What does a timeline look like from onboarding a new trial to seeing measurable improvements? And how do you set expectations with customers? Yeah. So for how we've how we how we work with our customers is we try to save all our customers time even from the very start. So in terms of the onboarding process as soon as we're working with our customers and obtain access to their systems most of the work that we do is pretty much automated. So typically in less than a week, we would be able to set up integrations with their data systems, spin up automated dashboards with outof-box best practice metrics that now we've mapped to many studies. And then from there, we'll work with our customers to fine-tune any metrics that might be very study specific and spin up any new visualizations that they might need specifically for their study.
[25:51] Looking ahead the next one, two years, what emerging technologies or operational practices excite you most for resolving bottlenecks? This has definitely been something that I've been thinking about and I think one of the most exciting trends coming up in the next year or two is AI and AI has been all over the news and I'm sure you would have already expected this answer but I really do think that AI has really great opportunity to help supercharge a lot of the manual work that's already been going on in drug development and in clinical trials. But also at the same time, I do think there's a lot of work that needs to be done to help to help help the industry get there because, you know, one of the key inputs to AI is data. And when you have data scattered across all these different data silos, it's really difficult to run AI. And if you're running AI on just a small subset of the data that you're you have, are you really getting the full picture? Are you really getting all the insights that you need? And how we're helping the biioarma industry get there is by making sure we serve as that glue between all of the different clinical trial systems and across different phases and across different therapeutic areas being able to bring all the data and providing that
[27:05] data infrastructure for AI to run on top of. And if we can do that in less than than a week as opposed to months if not years that it's currently taking big pharmaceutical companies, I think that'll be a really key differentiator in making sure we help the pharmaceutical industry not only stay ready for AI but also really leverage it when the time comes. For teams evaluating investments in operations, what is the minimum viable transparency/control room they should build this quarter to avoid delays moving forward? Yeah, especially for leaner biotech teams, you know, you might not have a lot of budget to, you know, spend on software or, you know, other even bringing on external consultants or contractors to build out um, you know, analytics dashboards. But I think the lowest hanging fruit that all of the biotech teams can be doing is making sure that they have a very consistent way of reporting out the data across teams. I personally think Excel is a great starting point. Excel comes free on everyone's computer and it's a no-brainer. But I think what you still want to be able to do is in Excel being able to consistently map the data from
[28:12] EDC from central labs from into that into a single tracker so that no one across the team is saying is this the right version of the file right or has this been updated. Making sure you designate a point person to be consistently updating that and making sure everyone's looking at the same thing. And I think that's the lowest hanging fruit, making sure that you have one designated person who's consistently updating data. I want to now move on to the rapid fire section of the pod. One one clinical ops metric you believe is undertracked but has high leverage. I think one underlyed metric is optimal number of referrals or screenings or number of activities that each site can take on in a given week and tracking that over time. The biggest misconception you hear from biotech leadership about reducing trial timelines.
[29:02] The biggest misconception misconception is you pay big dollars to a recruitment vendor and suddenly you're going to have your enrollment fulfilled quickly. Tool process or platform outside Miracle that's underrated or speeding up trial operations. I would have to say Smart Sheets is one of those tools just because it is even though it is a spreadsheet tool, I I think they have a lot of bells and whistles that are baked in to help bring in data from different sources into a spreadsheet. A book, paper, or resource that shaped your thinking on operational infrastructures in biotech. This is an easy one. Unnecessary expense written by Charles Stewart. In one sentence, the future of clinical operations is efficiency. Jyn, thanks for showing us what true operational transparency in clinical trials looks like. From integrating systems, building forecasts to making data visibility a core habit.
[29:58] If you're fighting delays, start with connecting your data sources, adopting dashboards with live metrics, and setting frequent feedback loops. Want to explore more? Visit miracleml.com. If this episode helped you rethink your trials timelines, subscribe to GTM Vault, share it with your ClinOps and trial leadership peers, and join us next week for another look at how operations becomes a growth lever. Tech founders and VCs careers lessons GTM